top
Shows CPU, memory and the busiest processes live, updated every few seconds.
Syntax
top [OPTION]...
Options
| Option | Description |
|---|---|
-o FIELD |
Sort by this column, e.g. %MEM |
-u USER |
Only show processes of USER |
-p PID |
Only show these processes (comma-separated) |
-d SECONDS |
Update interval |
-b |
Batch mode: plain text output, for scripts and logs |
-n NUMBER |
Stop after NUMBER updates |
Keys inside top:
| Key | Action |
|---|---|
| Shift+P / Shift+M | Sort by CPU / memory |
| 1 | Show every CPU core separately |
| C | Show the full command line |
| U | Only show the processes of one user |
| K | Send a signal to a process (asks for the PID) |
| Q | Quit |
Examples
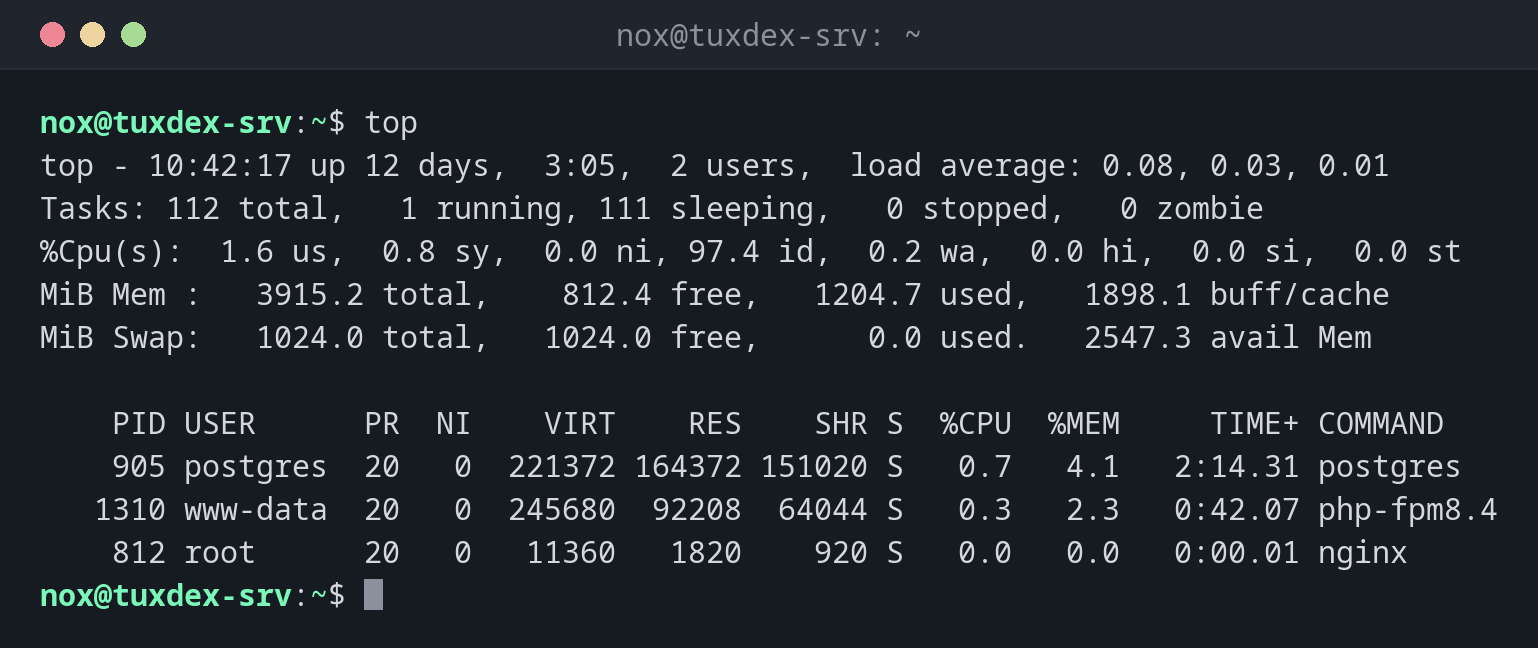
Start top:
top
top - 10:42:17 up 12 days,  3:05,  2 users,  load average: 0.08, 0.03, 0.01
Tasks: 112 total,   1 running, 111 sleeping,   0 stopped,   0 zombie
%Cpu(s):  1.6 us,  0.8 sy,  0.0 ni, 97.4 id,  0.2 wa,  0.0 hi,  0.0 si,  0.0 st
MiB Mem :   3915.2 total,    812.4 free,   1204.7 used,   1898.1 buff/cache
MiB Swap:   1024.0 total,   1024.0 free,      0.0 used.   2547.3 avail Mem

    PID USER      PR  NI    VIRT    RES    SHR S  %CPU  %MEM     TIME+ COMMAND
    905 postgres  20   0  221372 164372 151020 S   0.7   4.1   2:14.31 postgres
   1310 www-data  20   0  245680  92208  64044 S   0.3   2.3   0:42.07 php-fpm8.4
    812 root      20   0   11360   1820    920 S   0.0   0.0   0:00.01 nginx
| Line | Meaning |
|---|---|
top - |
Time, uptime, users and load average, like uptime |
Tasks |
Number of processes per state, including zombies |
%Cpu(s) |
us programs, sy kernel, id idle, wa waiting for disk, st stolen by the hypervisor |
MiB Mem, MiB Swap |
Memory and swap, avail Mem is what programs can still use |
Sort by memory:
top -o %MEM
    PID USER      PR  NI    VIRT    RES    SHR S  %CPU  %MEM     TIME+ COMMAND
    905 postgres  20   0  221372 164372 151020 S   0.7   4.1   2:14.31 postgres
   1310 www-data  20   0  245680  92208  64044 S   0.3   2.3   0:42.07 php-fpm8.4
Only watch the processes of one user:
top -u www-data
    PID USER      PR  NI    VIRT    RES    SHR S  %CPU  %MEM     TIME+ COMMAND
   1310 www-data  20   0  245680  92208  64044 S   0.3   2.3   0:42.07 php-fpm8.4
    813 www-data  20   0   12968   5876   3912 S   0.0   0.1   0:03.12 nginx
Save a snapshot for a report or a script:
top -b -n 1 | head -n 5
top - 10:42:17 up 12 days,  3:05,  2 users,  load average: 0.08, 0.03, 0.01
Tasks: 112 total,   1 running, 111 sleeping,   0 stopped,   0 zombie
%Cpu(s):  1.6 us,  0.8 sy,  0.0 ni, 97.4 id,  0.2 wa,  0.0 hi,  0.0 si,  0.0 st
MiB Mem :   3915.2 total,    812.4 free,   1204.7 used,   1898.1 buff/cache
MiB Swap:   1024.0 total,   1024.0 free,      0.0 used.   2547.3 avail Mem
When do I need it?
- When a server is slow: which process uses the CPU, is it waiting for the disk (
wa)? - To watch memory and swap during a backup, an import or a deployment
- To find runaway processes and end them directly with K
A high wa value
wa is the time the CPU waits for disk or network storage. If it stays above a few
percent, the storage is the bottleneck, not the CPU.
st on virtual servers
st (steal) is CPU time the hypervisor gives to other VMs. A constantly high value
means your VM doesn't get the CPU it should. That is a matter for your hosting
provider.