rabbitmq-diagnostics
Health checks and diagnostics for RabbitMQ: is the node running, are there alarms, which ports does it listen on, where does the memory go?
Syntax
rabbitmq-diagnostics COMMAND [OPTIONS]
Options
| Command | Description |
|---|---|
ping |
Is the node process reachable |
check_running |
Is RabbitMQ fully started |
check_local_alarms, alarms |
Memory or disk alarms that block publishers |
listeners |
Ports and protocols |
check_port_connectivity |
Can all listeners actually be reached |
memory_breakdown --unit mb |
Memory use by category |
check_virtual_hosts |
Are all vhosts running |
server_version |
Version of the node |
All check_* commands return exit code 0 on success and something else on failure, so they fit health checks and monitoring scripts.
Examples
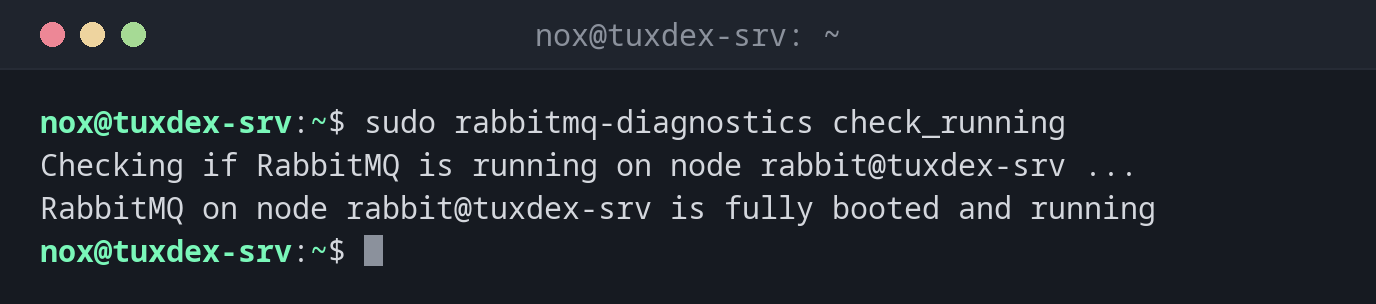
Is RabbitMQ fully started:
sudo rabbitmq-diagnostics check_running
Checking if RabbitMQ is running on node rabbit@tuxdex-srv ...
RabbitMQ on node rabbit@tuxdex-srv is fully booted and running
A quick ping:
sudo rabbitmq-diagnostics ping
Will ping rabbit@tuxdex-srv. This only checks if the OS process is running and registered with epmd. Timeout: 60000 ms.
Ping succeeded
Any alarms:
sudo rabbitmq-diagnostics alarms
Asking node rabbit@tuxdex-srv to report any known resource alarms ...
Node rabbit@tuxdex-srv reported no alarms, local or clusterwide
Ports and protocols:
sudo rabbitmq-diagnostics listeners
Asking node rabbit@tuxdex-srv to report its protocol listeners ...
Interface: [::], port: 25672, protocol: clustering, purpose: inter-node and CLI tool communication
Interface: [::], port: 5672, protocol: amqp, purpose: AMQP 0-9-1 and AMQP 1.0
Interface: [::], port: 15672, protocol: http, purpose: HTTP API
Can the ports be reached:
sudo rabbitmq-diagnostics check_port_connectivity
Testing TCP connections to all active listeners on node rabbit@tuxdex-srv using hostname resolution ...
Will connect to tuxdex-srv:25672
Will connect to tuxdex-srv:5672
Will connect to tuxdex-srv:15672
Successfully connected to ports 5672, 15672, 25672 on node rabbit@tuxdex-srv (using node hostname resolution)
Where the memory goes:
sudo rabbitmq-diagnostics memory_breakdown --unit mb | head -6
Reporting memory breakdown on node rabbit@tuxdex-srv...
reserved_unallocated: 62.5746 mb (43.4%)
other_system: 24.8761 mb (17.25%)
code: 23.1151 mb (16.03%)
other_proc: 19.0796 mb (13.23%)
allocated_unused: 8.6889 mb (6.03%)
When do I need it?
- As a health check for systemd, Docker or a monitoring system
- When applications can't publish any more: is there a memory or disk alarm?
- To check after a change which ports RabbitMQ listens on
Stages of health checks
From cheap to thorough: ping → check_running → check_local_alarms →
check_port_connectivity. For a container health check, ping is usually enough.
Alarms stop publishers
If RabbitMQ uses more than its memory limit (vm_memory_high_watermark, 0.6 of RAM) or
free disk falls below disk_free_limit, it blocks all publishing connections. The
application then hangs without an error message.
Distribution differences
| Debian | Ubuntu | RHEL | Arch | |
|---|---|---|---|---|
| Package | rabbitmq-server |
rabbitmq-server |
not in the repositories: repository of the RabbitMQ team | rabbitmq |