promtool
The tool kit of Prometheus: checks configuration and alert rules, runs PromQL queries on the command line and tests rules.
Syntax
promtool check config FILE
promtool check rules FILE...
promtool query instant URL QUERY
Options
| Command | Description |
|---|---|
check config FILE |
Check prometheus.yml and the rule files it names |
check rules FILE... |
Check rule files |
check metrics |
Check metrics from stdin against the naming rules |
query instant URL QUERY |
Run a PromQL query against a server |
query range URL QUERY --start --end |
Query a time range |
test rules FILE |
Run unit tests for alert rules |
promtool comes with the prometheus package. Its exit code is 0 if everything is valid, which makes it a good fit for scripts and CI.
Examples
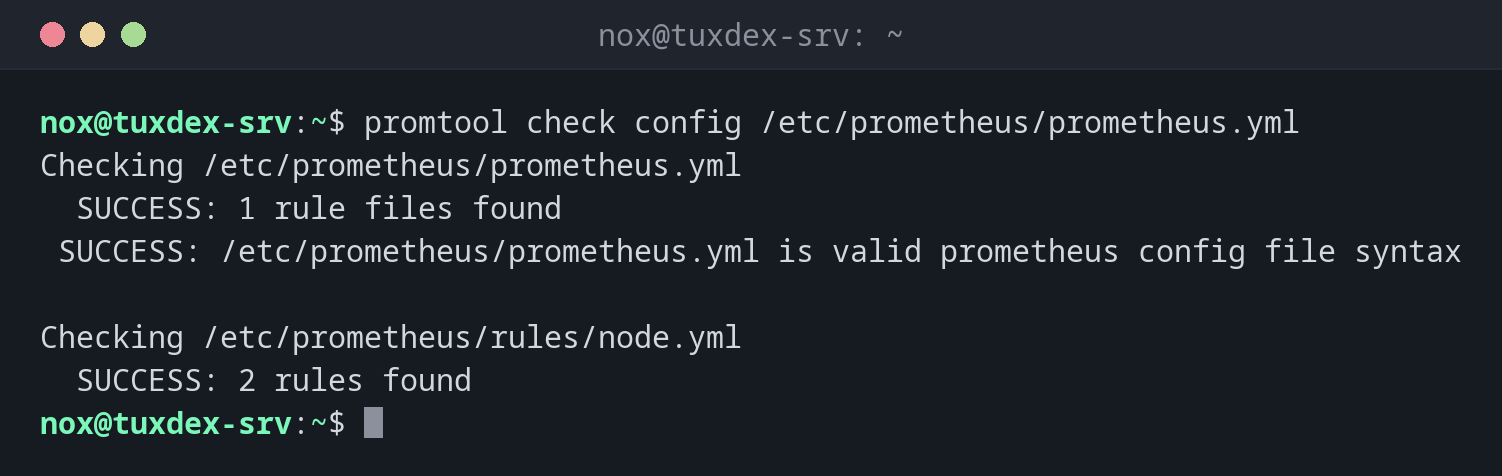
Check the configuration including the rules:
promtool check config /etc/prometheus/prometheus.yml
Checking /etc/prometheus/prometheus.yml
  SUCCESS: 1 rule files found
 SUCCESS: /etc/prometheus/prometheus.yml is valid prometheus config file syntax

Checking /etc/prometheus/rules/node.yml
  SUCCESS: 2 rules found
An error in a rule file:
promtool check rules /etc/prometheus/rules/node.yml
Checking /etc/prometheus/rules/node.yml
  FAILED:
/etc/prometheus/rules/node.yml: unknown unit " minutes" in duration "2 minutes"
Durations are written as 2m, 1h or 7d.
An error in the configuration:
promtool check config /etc/prometheus/prometheus.yml
Checking /etc/prometheus/prometheus.yml

  FAILED: parsing YAML file /etc/prometheus/prometheus.yml: not a valid duration string: "15"
scrape_interval: 15 lacks the unit; correct is 15s.
Which targets are down:
promtool query instant http://localhost:9090 'up == 0'
up{instance="192.0.2.21:9100", job="node"} => 0 @[1793007737.358]
RAM usage of all servers in percent:
promtool query instant http://localhost:9090 \
  '100 * (1 - node_memory_MemAvailable_bytes / node_memory_MemTotal_bytes)'
{instance="192.0.2.22:9100", job="node"} => 71.48203125 @[1793007737.358]
{instance="localhost:9100", job="node"} => 36.47693447 @[1793007737.358]
Which alerts are firing right now:
promtool query instant http://localhost:9090 ALERTS
ALERTS{alertname="InstanceDown", alertstate="firing", instance="192.0.2.21:9100", job="node", severity="critical"} => 1 @[1793007737.358]
When do I need it?
- Before every reload of Prometheus, after changing the configuration or rules
- In CI, so that broken rules never reach the server
- For quick queries in a terminal, without opening the web interface
Check rules in CI
A step promtool check rules rules/*.yml in your pipeline finds typos before the merge.
With promtool test rules you can even prove that an alert fires for given values.
Valid doesn't mean useful
check rules checks the syntax. A rule with a wrong metric name is valid and just never
fires. Test new expressions with promtool query instant first: no output means no data.
Distribution differences
| Debian | Ubuntu | RHEL | Arch | |
|---|---|---|---|---|
| Package | prometheus |
prometheus |
in the release archive of Prometheus | prometheus |