htop
The more comfortable version of
top: coloured bars, scrolling, mouse support, search, tree view and killing processes with a few keys.
Syntax
htop [OPTION]...
Options
| Option | Description |
|---|---|
-u USER |
Only show processes of USER |
-p PID,PID |
Only show these processes |
-t, --tree |
Start in tree view |
-s COLUMN |
Sort by this column, e.g. PERCENT_MEM |
-d TENTHS |
Update interval in tenths of a second |
Keys inside htop:
| Key | Action |
|---|---|
| F3 / / | Search for a process |
| F4 / \ | Filter: only show matching processes |
| F5 / T | Switch tree view on and off |
| F6 | Choose the sort column |
| F9 / K | Send a signal to the selected process |
| Space | Mark processes, to send a signal to several at once |
| F10 / Q | Quit |
Examples
Start htop:
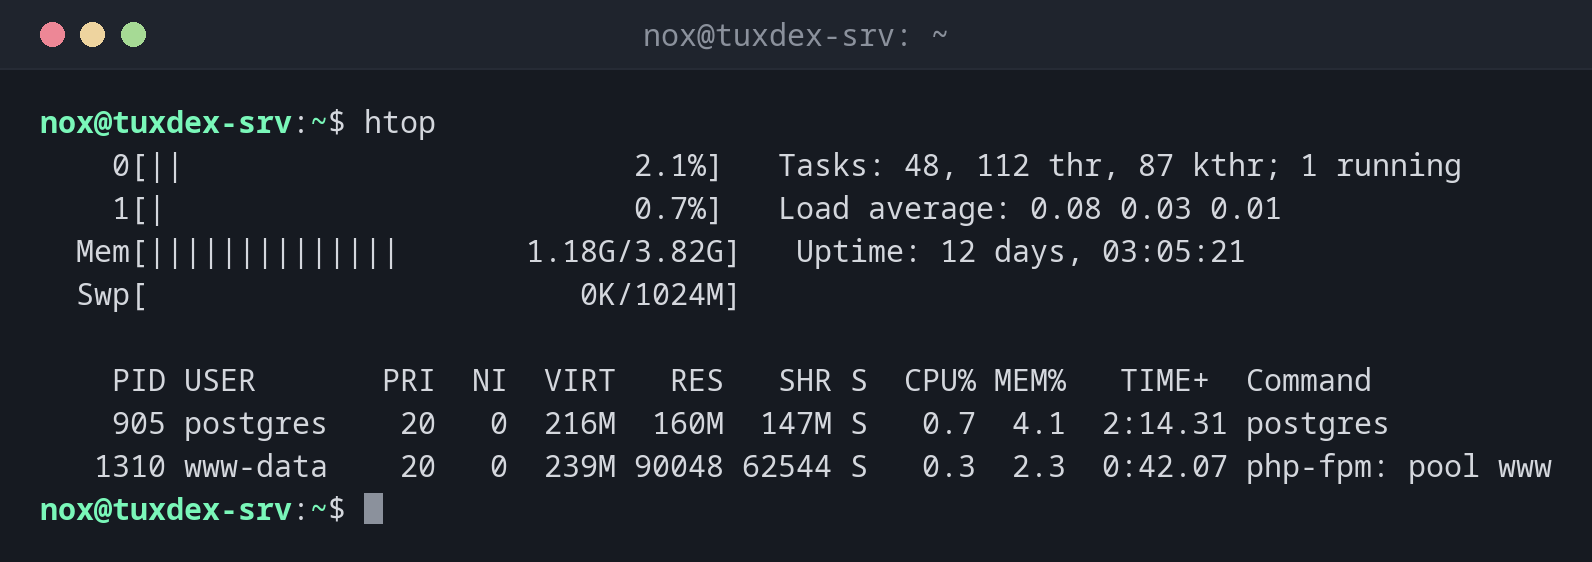
htop
    0[||                         2.1%]   Tasks: 48, 112 thr, 87 kthr; 1 running
    1[|                          0.7%]   Load average: 0.08 0.03 0.01
  Mem[||||||||||||||       1.18G/3.82G]   Uptime: 12 days, 03:05:21
  Swp[                        0K/1024M]

    PID USER       PRI  NI  VIRT   RES   SHR S  CPU% MEM%   TIME+  Command
    905 postgres    20   0  216M  160M  147M S   0.7  4.1  2:14.31 postgres
   1310 www-data    20   0  239M 90048 62544 S   0.3  2.3  0:42.07 php-fpm: pool www
At the top, one bar per CPU core plus memory and swap. Below, the process list as in
top.
Only show the processes of one user:
htop -u www-data
    PID USER       PRI  NI  VIRT   RES   SHR S  CPU% MEM%   TIME+  Command
   1310 www-data    20   0  239M 90048 62544 S   0.3  2.3  0:42.07 php-fpm: pool www
    813 www-data    20   0 12968  5876  3912 S   0.0  0.1  0:03.12 nginx: worker process
Start in tree view:
htop -t
    PID USER       PRI  NI  VIRT   RES   SHR S  CPU% MEM%   TIME+  Command
    812 root        20   0 11360  1820   920 S   0.0  0.0  0:00.01 nginx: master process
    813 www-data    20   0 12968  5876  3912 S   0.0  0.1  0:03.12 ├─ nginx: worker process
    814 www-data    20   0 12968  5852  3908 S   0.0  0.1  0:03.08 └─ nginx: worker process
When do I need it?
- When a server is slow and you want to see at a glance which cores and processes are busy
- To find, filter and end processes quickly, also several at once
- To understand the structure of services in the tree view
Filter instead of searching
F4 and a word like php hides everything else. You then only see the processes
you are interested in, and the filter stays active while htop updates.
Not on every server
htop is not installed by default on most distributions, and on RHEL it is only in
the EPEL repository. top is always there.
Distribution differences
| Debian | Ubuntu | RHEL | Arch | |
|---|---|---|---|---|
| Installed by default | no | yes (server) | no | no |
| Install | sudo apt install htop |
sudo apt install htop |
from EPEL: sudo dnf install epel-release, then sudo dnf install htop |
sudo pacman -S htop |