kubectl top
Shows the current CPU and memory usage of nodes and pods.
Syntax
kubectl top nodes | pods [NAME] [OPTIONS]
Options
| Option | Description |
|---|---|
nodes |
Usage of the nodes |
pods |
Usage of the pods |
-n NAMESPACE, -A |
Pods of one namespace, or of all |
--containers |
Show each container of a pod separately |
--sort-by=cpu, --sort-by=memory |
Sort by usage |
CPU is given in millicores: 250m is a quarter of a CPU core.
Examples
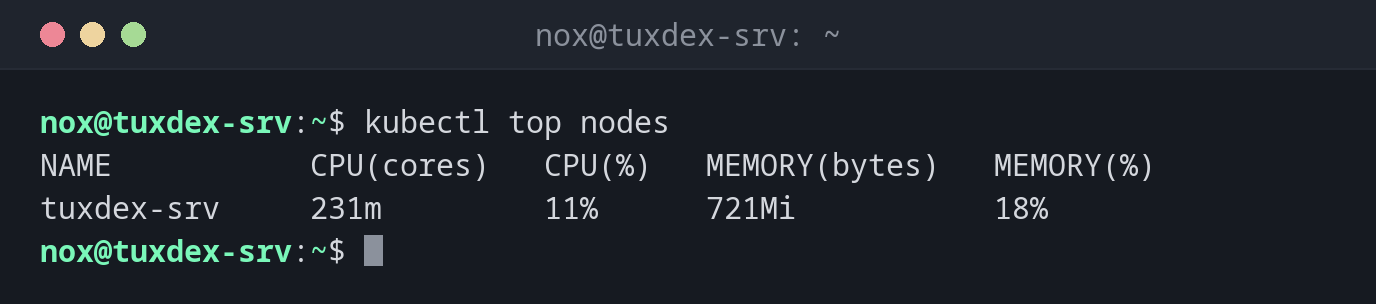
Usage of the nodes:
kubectl top nodes
NAME           CPU(cores)   CPU(%)   MEMORY(bytes)   MEMORY(%)
tuxdex-srv     231m         11%      721Mi           18%
The pods with the most memory first:
kubectl top pods -A --sort-by=memory
NAMESPACE     NAME                                      CPU(cores)   MEMORY(bytes)
kube-system   traefik-6f986b958c-v9bwd                  2m           41Mi
kube-system   metrics-server-7b9c9c4b9c-m8shl           9m           22Mi
kube-system   coredns-7896679cc-2dcm2                   3m           17Mi
status        web-9bc5f7f5b-8ptw2                       3m           12Mi
status        web-9bc5f7f5b-m8l96                       3m           12Mi
kube-system   local-path-provisioner-578895bd58-x8h47   1m           8Mi
One namespace:
kubectl top pods -n status
NAME                  CPU(cores)   MEMORY(bytes)
web-9bc5f7f5b-8ptw2   3m           12Mi
web-9bc5f7f5b-m8l96   3m           12Mi
When do I need it?
- When the cluster is slow and you're looking for the pod that eats the resources
- To set sensible values for
requestsandlimits - To see how full a node is before you add more pods
Needs the metrics server
kubectl top gets its numbers from the metrics server. k3s installs it; in other
clusters without it, you get error: Metrics API not available.