prometheus
The Prometheus server: collects metrics from all targets, stores them as time series and evaluates alert rules.
Syntax
prometheus [--config.file=FILE] [--storage.tsdb.path=DIR] [--storage.tsdb.retention.time=TIME]
Options
| Option | Description |
|---|---|
--config.file= |
Configuration file, usually /etc/prometheus/prometheus.yml |
--storage.tsdb.path= |
Directory for the data |
--storage.tsdb.retention.time= |
How long data is kept, default 15d |
--storage.tsdb.retention.size= |
Maximum size of the data, e.g. 20GB |
--web.listen-address= |
Address and port, default :9090 |
--web.enable-lifecycle |
Allow reloading via POST /-/reload |
--version |
Version and build information |
On Debian and Ubuntu the options go into ARGS="…" in /etc/default/prometheus. sudo systemctl reload prometheus reads the configuration again without a restart.
Examples
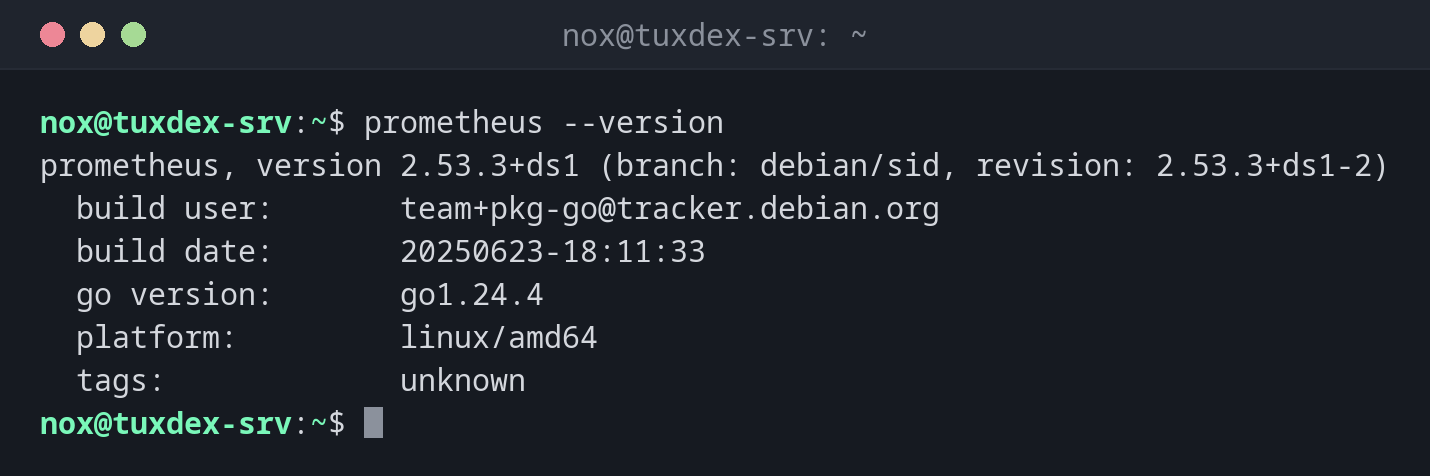
Version of the server:
prometheus --version
prometheus, version 2.53.3+ds1 (branch: debian/sid, revision: 2.53.3+ds1-2)
  build user:       team+pkg-go@tracker.debian.org
  build date:       20250623-18:11:33
  go version:       go1.24.4
  platform:         linux/amd64
  tags:             unknown
Is Prometheus healthy:
curl -s localhost:9090/-/healthy
Prometheus Server is Healthy.
The scrape targets in the configuration:
grep -A3 'job_name: node' /etc/prometheus/prometheus.yml
  - job_name: node
    static_configs:
      - targets: ['localhost:9100', '192.0.2.21:9100', '192.0.2.22:9100']
Add a target and reload:
sudoedit /etc/prometheus/prometheus.yml
promtool check config /etc/prometheus/prometheus.yml >/dev/null && sudo systemctl reload prometheus
systemctl is-active prometheus
active
Which targets are down, and why:
curl -s localhost:9090/api/v1/targets | jq -r '.data.activeTargets[] | "\(.labels.instance) \(.health) \(.lastError)"'
192.0.2.21:9100 down Get "http://192.0.2.21:9100/metrics": context deadline exceeded
192.0.2.22:9100 up
localhost:9100 up
localhost:9090 up
context deadline exceeded means no answer within the scrape timeout: the server is off, or a firewall drops port 9100.
How much space the data takes:
sudo du -sh /var/lib/prometheus/metrics2
1.2G /var/lib/prometheus/metrics2
When do I need it?
- To set up central monitoring for several servers
- To find out why a target is
down - To limit how much disk space the monitoring data takes
The web interface for quick checks
http://tuxdex-srv:9090 has the pages Graph for PromQL queries, Status > Targets
with every target and its last error, and Alerts with the state of all rules. From
another machine through an SSH tunnel: ssh -L 9090:localhost:9090 nox@tuxdex-srv.
Plan the disk space
Every target produces about a thousand time series. With many servers and a long retention
the data directory grows to many gigabytes. Set --storage.tsdb.retention.size so a full
disk doesn't stop the monitoring.
Distribution differences
| Debian | Ubuntu | RHEL | Arch | |
|---|---|---|---|---|
| Package | prometheus |
prometheus |
not in the repositories: release archive or container prom/prometheus |
prometheus |
| Options in | /etc/default/prometheus |
/etc/default/prometheus |
own systemd unit | /etc/conf.d/prometheus |
| Data | /var/lib/prometheus/metrics2 |
/var/lib/prometheus/metrics2 |
as configured | /var/lib/prometheus/data |
Related commands
node_exporter · promtool · amtool · jq