vmstat
Shows in one line per interval how busy CPU, memory, swap and disks are; the quickest overview when a server is slow.
Syntax
vmstat [OPTIONS] [INTERVAL [COUNT]]
Options
| Option | Description |
|---|---|
INTERVAL |
Print a new line every N seconds |
COUNT |
Stop after N lines |
-w |
Wide output, columns don't run into each other |
-S M |
Show memory in MB instead of KB |
-s |
Memory and event counters as a list |
-d |
Statistics per disk |
-t |
Add a timestamp to every line |
The most important columns:
| Column | Meaning | Watch out when |
|---|---|---|
r |
Processes waiting for a CPU | permanently higher than the number of cores |
b |
Processes blocked, usually waiting for disk I/O | not 0 for a longer time |
si, so |
Swapped in and out per second | not 0: memory is short |
us, sy |
CPU time for programs and kernel | together near 100 |
wa |
CPU waits for I/O | above about 10: disk is the bottleneck |
st |
Time stolen by the hypervisor | not 0 on a VM: the host is overloaded |
Examples
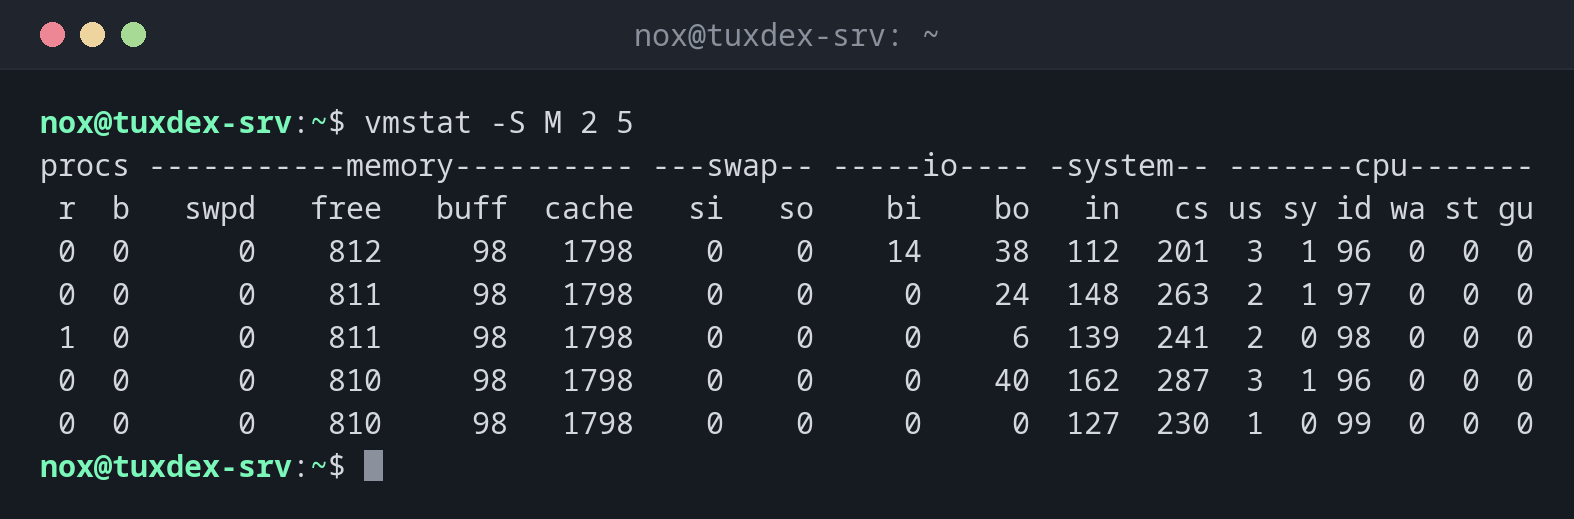
Five measurements, every two seconds:
vmstat -S M 2 5
procs -----------memory---------- ---swap-- -----io---- -system-- -------cpu-------
 r  b   swpd   free   buff  cache   si   so    bi    bo   in   cs us sy id wa st gu
 0  0      0    812     98   1798    0    0    14    38  112  201  3  1 96  0  0  0
 0  0      0    811     98   1798    0    0     0    24  148  263  2  1 97  0  0  0
 1  0      0    811     98   1798    0    0     0     6  139  241  2  0 98  0  0  0
 0  0      0    810     98   1798    0    0     0    40  162  287  3  1 96  0  0  0
 0  0      0    810     98   1798    0    0     0     0  127  230  1  0 99  0  0  0
An idle server: id (idle) near 100, no swap activity, no waiting processes.
A server that waits for the disk:
vmstat -S M 2 3
procs -----------memory---------- ---swap-- -----io---- -system-- -------cpu-------
 r  b   swpd   free   buff  cache   si   so    bi    bo   in   cs us sy id wa st gu
 1  3      0    205     98   2310    0    0  8420 21650 1890 2410  6  9 37 48  0  0
 0  4      0    198     98   2321    0    0  9104 23102 1977 2533  5 10 36 49  0  0
 1  3      0    201     98   2319    0    0  8833 22410 1920 2487  6  9 35 50  0  0
b is 3 to 4 and wa around 50 %: processes wait for the disk while the CPU has time. Next step: iostat -x and iotop.
Memory is short and the server swaps:
vmstat -S M 2 3
procs -----------memory---------- ---swap-- -----io---- -system-- -------cpu-------
 r  b   swpd   free   buff  cache   si   so    bi    bo   in   cs us sy id wa st gu
 3  1    612     54      4    121  310  498  1310  1902 1488 1720 41 12 22 25  0  0
 2  2    640     49      4    118  352  514  1402  2011 1530 1798 39 14 21 26  0  0
 4  1    671     51      3    115  288  476  1250  1876 1501 1755 43 12 20 25  0  0
si and so are permanently above zero: the server constantly moves memory to disk and back. Find the process that needs so much memory, see top.
When do I need it?
- As the first command when a server is slow: CPU, memory or disk?
- To watch a load test or a backup run live
- To find out whether a VM suffers from an overloaded host (
st)
Ignore the first line
The first line shows averages since the boot, not the current state. Look at the
following lines, such as with vmstat 2 5.